Increasing Awareness about Air Quality through Open Data

Report by Ewoenam Kukah (DiV) & Gameli Adzaho
Air quality is a growing public health concern in fast developing and urbanising communities, contributing to about 7 million deaths globally every year. In Ghana, some estimates hold that poor air quality contributes to 17000 deaths per year. It is also recognised as one of the fastest rising causes of ill health. Unfortunately because poor air quality is often invisible, its danger to our wellbeing could be missed. Monitoring and sharing information about air pollution in an area over time could help governments, community groups, and citizens identify ‘trouble spots’ and collaboratively work out solutions to improve local air quality. The tech community can also contribute to this effort, by building tools and information resources, as well as being part of the dialogue, to create sustainable change in our communities.
In May 2018, the Accra OpenAQ Workshop brought together a community of local and international individuals and organisations working towards the goal of better air quality in Ghana. One key output of this two-day engagement was a Community Statement on Air Quality in Ghana which highlights some challenges of air quality in Ghana as well as opportunities for positive impact, one of which includes collection and access to better data on air quality.
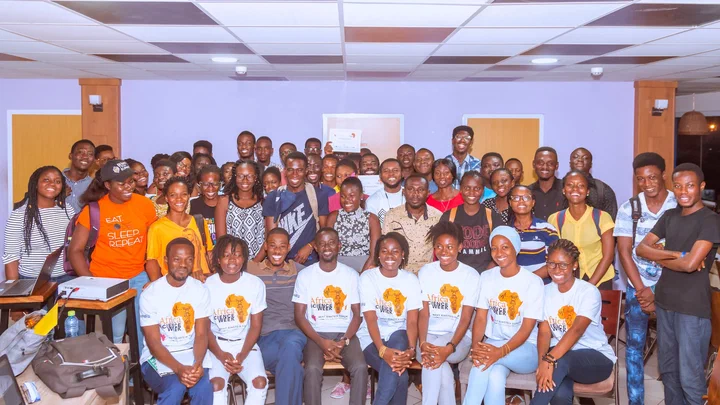
As part of the Next Einstein Forum Africa Science Week 2018, Global Lab Network and Developers in Vogue partnered to organize a Datathon (data science hackathon) which challenged participants to use open data to explore air quality in Accra. It was held at the Workshed in Spintex, Accra on Saturday, 29th September 2018. Participants were grouped into teams and tasked to analyse research data on air quality to produce outputs that could draw the attention of the government and the public to ‘air inequality’ in Accra. This included data visualisations/infographics, maps, predictive models and app and website prototypes.
 Play video: Video from “Increasing Awareness about Air Quality through Open Data”
Before the datathon, the NEF Ambassador to Ghana, Peter Asare-Nuamah, gave an overview of NEF and its goal of transforming science in Africa. Africa Science Week is one of its initiatives aimed at popularising science on the continent. Gameli Adzaho of Global Lab then presented the challenge, by giving an overview of air quality and examples of how to fight ‘air inequality’ with open data.
Judges
The following individuals graciously volunteered to be judges for the event:
- Dr. Jamal Abdullai – Head of Department, Computer Science Department, University of Ghana.
- Gameli Adzaho – Founder, Global Lab Network
- Darlington Akogo – Founder, minoHealth
- Richard Bempong – Co-founder, the Workshed
Teams
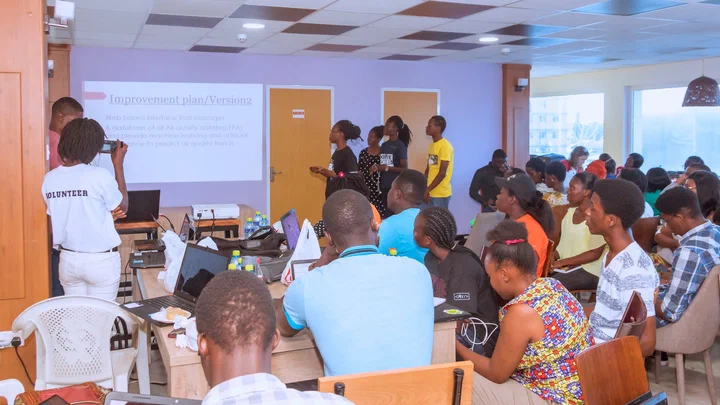
There were 15 groups of four or five members. The teams and their projects are as follows:
| Team | Project |
|---|---|
| Team Alpha | Integrating the air quality index of locations into apps like Uber and Google maps |
| Team Breezy | An app that notifies users of changes in air quality through app notifications and SMS |
| EmavData* | A database that uses machine learning to track trends in air quality |
| Zigma | Constant monitoring of slums which are linked to poor air quality |
| Data Rangers | Use of social media campaign to fight air pollution |
| O2 | An API to know the levels of air quality by sending a short code and location of interest |
| C++ | Sensors that collect air quality information and send a broadcast message to those in the area of low air quality |
| Team Komplex | A dashboard containing a display of air quality data in a graphical form. |
| Team Revo | Social media and TV notification of levels of air quality |
| Team Bheed | A web map showing a location distribution of air quality and associated data including a routing feature. |
| Team Naa2MT* | An automatic prediction template to help the EPA predict air pollution in any location. |
| Team Smocy | A graph showing the air quality levels and linking those levels to causes based on the locations. |
| Data Ginie | Visualizing the least and highest levels of air quality using Tableau, ANOVA and R. |
| ECSR | An Excel based analysis solution with interactive visualization showing the ‘intensity distribution’ of air quality levels. |
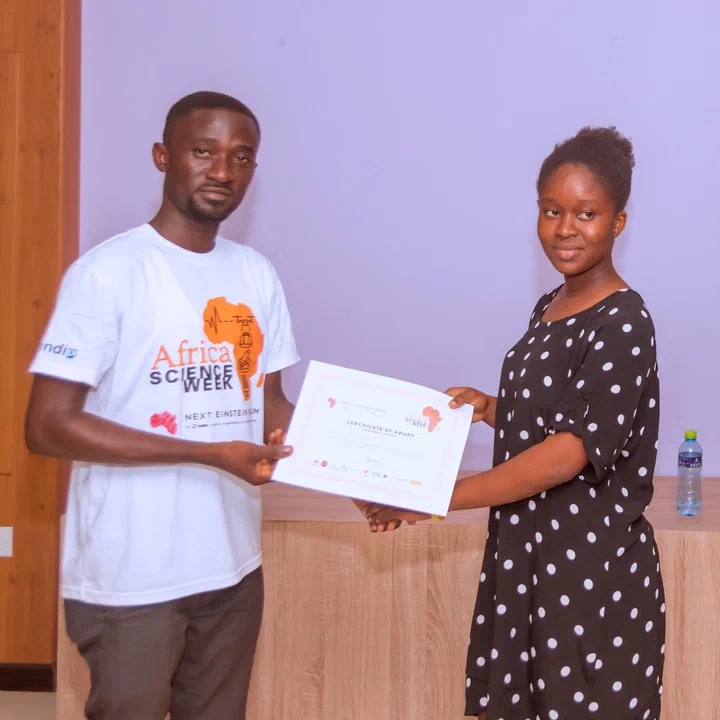
Out of these incredibly innovative teams, Emav Data, Team Naa2MT and Team Alpha placed 1st to 3rd respectively. All victorious teams received cash prizes and certificates for their outstanding solutions.
Recommendations
The programme went really well and many of the participants openly expressed their delight. However, there were some suggestions on how we can improve the programme for future events:
- Have fewer groups with a larger number of members in order not to have an unusually long event.
- Have a longer time period for the Datathon, eg, two days, so that the participants will have more time to work on the problem statement.
Appreciation
Thank you to Next Einstein Forum Africa Science Week for the opportunity to host this event. We’re equally grateful to Open AQ, who offered guidance and gave us access to data on their platform, and Dr Pallavi Pant of Air South Asia for supporting our preparation through the Open Data and Air Quality Toolkit.